
How Stock Prices Are Determined in India: A Simple Guide
 Oct, 29 2026
You stare at your trading app. The number next to Reliance Industries is ticking up by ₹2. You didn't buy it yet, but you feel a tiny pang of regret. Why did it go up? Who decided that Reliance is worth exactly ₹2,950 right now? It’s not like there’s a government official sitting in Delhi with a calculator deciding the price every morning. The truth is far more chaotic and fascinating. Share prices are determined by a massive, continuous auction between millions of people who disagree about what a company is actually worth.
If you’ve ever felt confused about why a stock jumps or crashes without any obvious news, you’re not alone. Most beginners think the price reflects the "true" value of a business. It doesn’t. It reflects the last price someone was willing to pay. This distinction changes how you look at investing forever. Let’s break down exactly how this mechanism works in the Indian context, from the tickers on the National Stock Exchange (NSE) to the logic behind the numbers.
The Core Mechanism: Supply and Demand
At its heart, the stock market is just a marketplace for buying and selling ownership slices of companies. Think of it like a vegetable market, but instead of tomatoes, people trade shares of companies like Tata Motors or HDFC Bank. The price moves based on two simple forces: buyers wanting in and sellers wanting out.
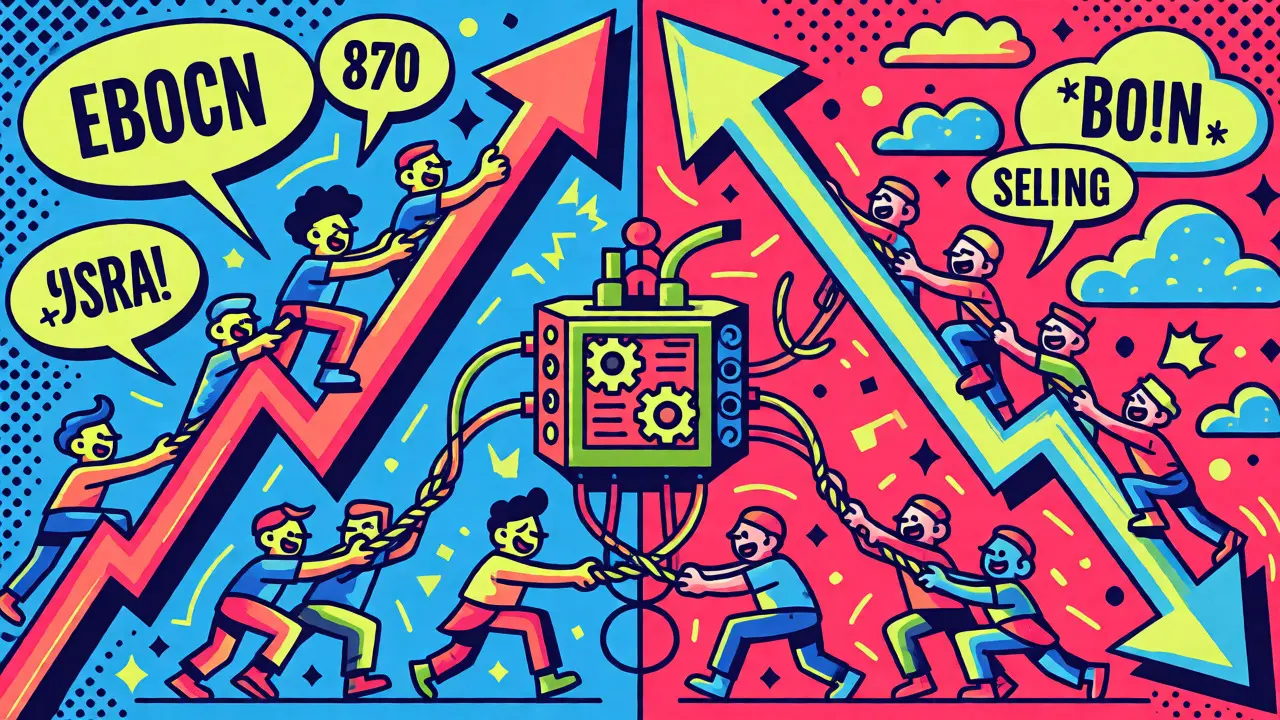
When more people want to buy a stock than sell it, the price goes up. Buyers have to bid higher to convince sellers to part with their shares. Conversely, if everyone wants to sell and few want to buy, the price drops because sellers must lower their asking price to find a taker. This isn't magic; it's basic economics playing out in real-time via computer algorithms.
| Market Condition | Buyer Behavior | Seller Behavior | Price Movement |
|---|---|---|---|
| Bullish Sentiment | Aggressive bidding, high volume | Holding back, expecting higher prices | Rising |
| Bearish Sentiment | Wait-and-see approach | Panic selling, accepting lower bids | Falling |
| Neutral/Sideways | Balanced interest | Balanced interest | Stable/Low Volatility |
The Role of Exchanges: NSE and BSE
In India, you don’t buy stocks directly from the company after they’ve gone public. You buy them from another investor on an exchange. The two main arenas for this are the Bombay Stock Exchange (BSE), the oldest in Asia, and the National Stock Exchange (NSE), which handles the bulk of daily trading volume today.
These exchanges run an electronic system called an order matching engine. When you place a "buy" order through your broker app, it gets sent to the exchange. The engine looks for a matching "sell" order. If someone is willing to sell at your price, the trade happens instantly. That transaction price becomes the new "last traded price," which is what you see flashing on your screen. It’s important to remember that this price applies only to that specific small chunk of shares traded. It doesn’t mean the whole company is valued at that rate per share for all time-it’s just the latest data point.
What Actually Moves the Price?
If supply and demand set the price, what shifts supply and demand? Several factors come into play, ranging from hard financial data to pure human emotion.
Earnings Reports: Every quarter, listed companies publish their results. Revenue, profit, and future guidance matter hugely. If Infosys reports profits that beat analyst expectations, traders rush to buy, driving the price up. If they miss targets, the opposite happens. In India, quarterly earnings season can cause wild swings in mid-cap stocks where liquidity is thinner.
Macroeconomic Factors: The broader economy plays a massive role. Interest rates set by the Reserve Bank of India (RBI) affect borrowing costs for companies. When rates rise, companies earn less, and investors prefer safer bonds over risky stocks, pushing prices down. Similarly, inflation data, GDP growth, and global events like oil price hikes impact sector-specific stocks differently. For instance, rising crude oil prices hurt paint companies but boost upstream oil explorers.
Sector Trends and News: Sometimes, a single piece of news moves a stock. A new government policy favoring electric vehicles might spike Tata Motors’s price before anyone checks the balance sheet. Rumors of mergers, regulatory changes, or even social media hype can trigger immediate buying or selling pressure.
Market Capitalization vs. Share Price
A common trap for beginners is confusing a high share price with a valuable company. A stock trading at ₹10,000 isn’t necessarily "expensive" compared to one trading at ₹100. What matters is Market Capitalization.
Market Cap = Current Share Price × Total Number of Outstanding Shares.
Let’s say Company A has a share price of ₹1,000 and 1 million shares. Its market cap is ₹1,000 crore. Company B has a share price of ₹10 but 1 billion shares. Its market cap is also ₹1,000 crore. They are equally large companies. Investors often ignore the absolute share price and focus on market cap to gauge size and risk. Small-cap stocks (lower market cap) tend to be more volatile than large-caps like ICICI Bank or State Bank of India.
Liquidity and Volume: The Hidden Driver
Have you ever tried to sell a rare comic book? You might ask for $100, but if no one buys it, your "price" is theoretical. Stocks work similarly. Liquidity refers to how easily you can buy or sell a stock without moving its price significantly.
High-volume stocks like those in the Nifty 50 index are highly liquid. Millions of shares change hands daily, so a single large order won’t crash the price. Low-volume penny stocks, however, are dangerous. If you try to sell a large position in an illiquid stock, you might have to drop the price drastically to find buyers, causing a sudden dip in the chart that looks scary but is just a liquidity issue.

How to Read the Order Book
Professional traders don’t just look at the last traded price. They look at the "order book" or "depth of market." This shows pending buy and sell orders at various price levels.
- Bid Price: The highest price a buyer is currently offering.
- Ask Price: The lowest price a seller is currently demanding.
- Spread: The difference between the Bid and Ask. A wide spread indicates low liquidity or high uncertainty.
If you see a huge wall of sell orders at ₹500, it means many people want to exit at that level. The price will likely struggle to break above ₹500 until those sellers are absorbed. Understanding this helps you time your entry better than just guessing based on the previous close.
Common Misconceptions About Price Determination
Many Indian retail investors believe that if a stock falls, it’s "cheap" and will bounce back. Not always. A falling price often signals fundamental deterioration. Another myth is that dividends increase share price permanently. When a company pays a dividend, the share price typically adjusts downward by the dividend amount on the ex-dividend date. The wealth hasn’t vanished; it’s just shifted from capital appreciation to cash in hand.
Also, remember that stock splits change the share price but not the market cap. If a ₹1,000 stock splits 1:10, the new price is ₹100. You own ten times as many shares, but your total investment value remains unchanged. Don’t mistake a split for a discount.
Practical Tips for Tracking Price Movements
To make sense of price action, follow these steps:
- Check Historical Data: Look at long-term charts, not just intraday spikes. Use platforms like Moneycontrol or TradingView to analyze trends over years.
- Monitor Institutional Activity: Foreign Portfolio Investors (FPIs) and Domestic Institutional Investors (DIIs) move big money. Their net buying/selling data is published daily and often dictates short-term trends.
- Read Quarterly Results Carefully: Don’t just look at the bottom line. Check operating margins and debt levels. A stock might rise on hype but fall when fundamentals are scrutinized.
- Understand Sector Rotation: Money flows between sectors. When IT stocks slow down, capital might rotate into banking or pharma. Tracking sector indices helps anticipate these shifts.
Who decides the opening price of a stock each day?
The opening price is determined during the pre-open session (from 9:00 AM to 9:15 AM). During this time, investors submit buy and sell orders. The exchange uses an algorithm to calculate a price that maximizes the number of trades possible. This equilibrium price becomes the opening price for the regular trading session starting at 9:15 AM.
Can a stock price go to zero?
Yes, theoretically and practically. If a company goes bankrupt and its assets are insufficient to cover debts, shareholders may receive nothing. In such cases, the stock price can plummet to fractions of a rupee. However, delisting usually occurs before it hits absolute zero, removing it from the exchange entirely.
Why do stock prices fluctuate so much intraday?
Intraday fluctuations are driven by high-frequency trading, news flow, and emotional reactions. Algorithms execute thousands of trades per second based on minute-by-minute data. Additionally, retail traders reacting to headlines or social media tips create rapid bursts of buying or selling, causing sharp price movements within hours.
Does the number of shares outstanding affect the price?
Indirectly, yes. More shares outstanding generally mean lower individual share prices for the same market cap. However, the key metric is market capitalization. A company issuing more shares dilutes existing shareholders' ownership, which can negatively impact the price if the new capital isn't used effectively to generate growth.
How does foreign investment impact Indian stock prices?
Foreign Portfolio Investors (FPIs) hold significant stakes in large-cap Indian stocks. When FPIs buy heavily, demand rises, pushing prices up. When they pull money out due to global risks or strong dollar values, selling pressure increases, often dragging the Nifty and Sensex indices down. Their activity is a major driver of short-to-medium term price trends.