
How to Evaluate ELSS Funds for Section 80C: Risk, Performance, and Expense Ratio Guide
 Aug, 14 2026
You have exactly three years to wait. That is the rule. You put your money into an Equity Linked Savings Scheme, commonly known as ELSS fund, which is a mutual fund category in India that offers tax benefits under Section 80C of the Income Tax Act while investing primarily in equities. Unlike Public Provident Fund (PPF) or National Pension System (NPS), which lock your money away for fifteen or even thirty years, ELSS gives you a much shorter lock-in period. But short does not mean safe. In fact, because these funds invest heavily in stocks, they carry market risk. If you pick the wrong one, you might save on taxes today but lose capital tomorrow.
The goal here is simple: maximize your tax deduction up to ₹1.5 lakh per financial year while ensuring your corpus grows enough to beat inflation. To do this, you need to look beyond just the returns. You need to dissect the risk profile, scrutinize the performance consistency, and understand how fees eat into your profits. Let’s break down exactly how to evaluate these funds so you don’t get burned by volatility or hidden costs.
Understanding the Core Mechanics of ELSS
Before you compare numbers, you must understand what you are buying. An ELSS fund is essentially a diversified equity mutual fund with a mandatory three-year lock-in period from the date of each investment. This means if you invest via Systematic Investment Plan (SIP), each installment has its own separate lock-in clock. This structure allows for rupee cost averaging, which can smooth out market volatility over time.
The primary appeal is the tax benefit. Under Section 80C of the Indian Income Tax Act, investments in ELSS qualify for deductions. However, it is crucial to remember that while the investment is tax-deductible, the gains are taxable. As of the current regime, long-term capital gains (LTCG) above ₹1.25 lakh in a financial year are taxed at 12.5%. This changes the math compared to older regimes where LTCG was exempt. You need to calculate your post-tax returns carefully.
Also, consider the liquidity aspect. While three years seems short, it is significant for emergency funds. Do not park money you might need next year in an ELSS. It is designed for medium-to-long-term wealth creation, not short-term parking.
Evaluating Risk: Beyond Just Volatility
Risk in ELSS funds is often misunderstood. Many investors look at past volatility and assume high volatility equals bad performance. That is not always true. Instead, you should look at specific risk metrics that tell you how the fund behaves relative to the market and its peers.
- Beta: This measures sensitivity to market movements. A beta of 1 means the fund moves in line with the benchmark (like Nifty 500). A beta greater than 1 indicates higher volatility than the market, while less than 1 suggests lower volatility. For aggressive growth, you might accept a beta of 1.1 or 1.2, but ensure the manager has the skill to generate alpha (excess returns) during downturns.
- Standard Deviation: This shows the dispersion of returns. A higher standard deviation means the returns are more spread out, indicating higher uncertainty. Compare this across funds in the same category. If two funds have similar returns but different standard deviations, the one with lower deviation is technically "safer" for those returns.
- Downside Capture Ratio: This is critical. It tells you how much the fund falls when the market falls. If the market drops 10% and the fund drops 12%, its downside capture is 120%. You want a fund with a downside capture ratio below 100%, meaning it protects capital better than the broader market during crashes.
Don't just look at the last year's data. Market cycles change. Look at rolling returns over 3, 5, and 7 years to see how the fund handled both bull and bear markets. A fund that only shines in a raging bull market but crumbles in a correction is risky for a locked-in product.
Analyzing Performance Consistency
Past performance is not a guarantee of future results, but it is the best evidence we have of a fund manager's capability. The key is consistency, not just peak returns. One great year can be luck; five great years suggest skill.
When evaluating performance, focus on CAGR (Compound Annual Growth Rate) rather than absolute returns. CAGR smooths out the compounding effect and gives a clearer picture of annualized growth. Compare the fund's CAGR against its benchmark index and its peer group average.
A common mistake is picking the top performer from the last 3 years. By the time you identify it and invest, the momentum may have shifted. Instead, look for funds that consistently rank in the top quartile (top 25%) of their category over 5 and 7-year periods. This approach reduces the chance of chasing past glory that won't repeat.
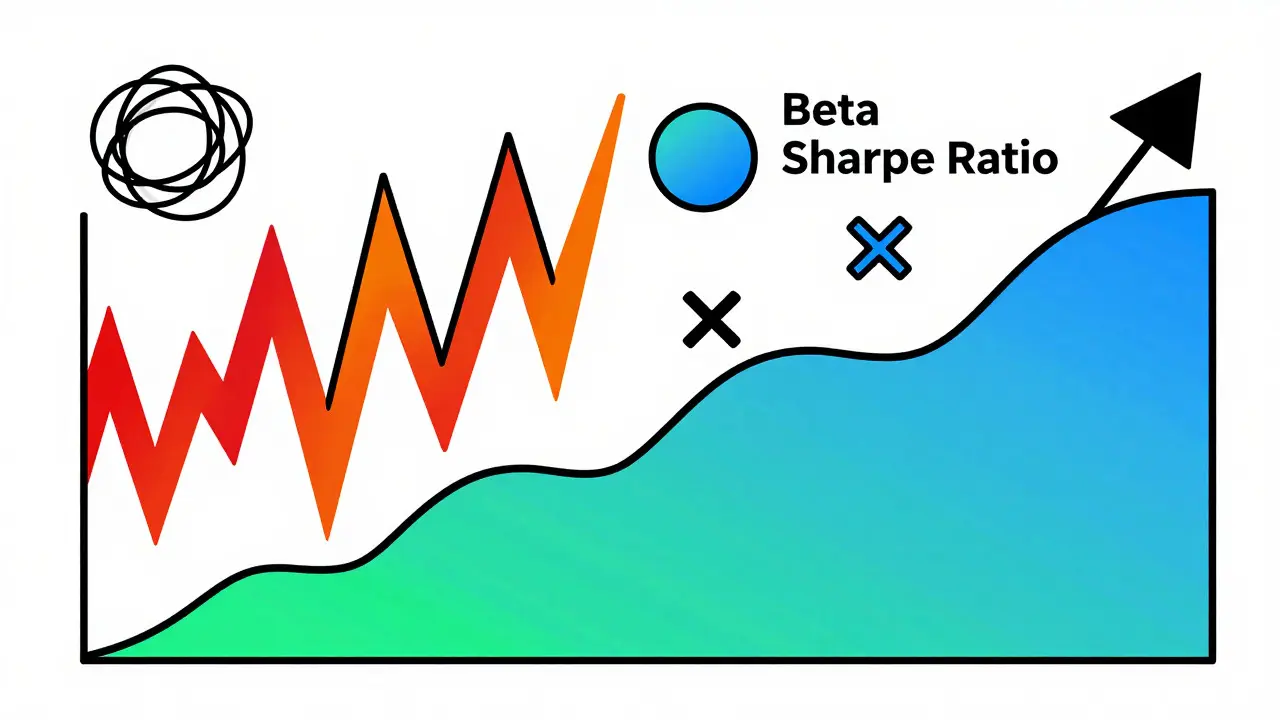
Also, check the Sharpe Ratio. This metric adjusts returns for risk taken. A higher Sharpe Ratio means better risk-adjusted returns. If Fund A returns 15% with high volatility and Fund B returns 14% with low volatility, Fund B likely has a better Sharpe Ratio and is the smarter choice for most investors.
The Hidden Cost: Expense Ratio Impact
Fees matter more than you think. The Expense Ratio is the annual fee charged by the mutual fund house to manage the fund, expressed as a percentage of the average assets under management. It includes management fees, administrative costs, and other operational expenses. This fee is deducted directly from the fund's assets, reducing your Net Asset Value (NAV).
Consider this example: Two funds return 12% gross annually. Fund X has an expense ratio of 1.5%, while Fund Y charges 0.8%. After fees, Fund X yields 10.5%, and Fund Y yields 11.2%. Over 10 years, that 0.7% difference compounds significantly. On a ₹1 lakh investment, you could end up with tens of thousands of rupees less in Fund X simply due to fees.
In India, the Securities and Exchange Board of India (SEBI) has capped expense ratios for open-ended equity schemes. Currently, the cap is around 2.21% for assets up to ₹100 crore, decreasing as assets grow. However, many large-cap ELSS funds charge between 1% and 1.5%. Always choose the lowest expense ratio among funds with similar risk profiles and consistent performance. Direct plans typically have lower expense ratios than regular plans because they cut out distributor commissions.
Fund Manager Tenure and Strategy
Mutual funds are people businesses. The fund manager's experience and stability are vital. Check how long the current manager has been handling the fund. Frequent changes in management can disrupt strategy and lead to inconsistent performance. Ideally, look for managers with at least 5-7 years of tenure on the specific scheme.
Understand the fund's investment style. Is it a large-cap focused ELSS, or does it dive deep into mid and small caps? Large-cap ELSS funds are generally less volatile and suitable for conservative investors seeking steady tax-saving growth. Mid and small-cap oriented ELSS funds offer higher growth potential but come with significantly higher risk and volatility. Given the 3-year lock-in, a pure small-cap ELSS might be too risky unless you have a high risk appetite and a longer overall horizon.
Read the quarterly portfolio disclosures. See if the manager sticks to their stated mandate. If a fund claims to be conservative but holds 60% in speculative small-caps, there is a mismatch between promise and reality.

Comparison Table: Key Metrics for Evaluation
| Metric | What to Look For | Why It Matters |
|---|---|---|
| Expense Ratio | Lowest in peer group (<1.5% ideal) | Directly reduces net returns over time |
| Rolling Returns (5Y & 7Y) | Consistently in top quartile | Indicates sustained skill, not just luck |
| Beta | Between 0.9 and 1.1 for balanced risk | Shows sensitivity to market swings |
| Sharpe Ratio | Higher than peer average | Better returns per unit of risk taken |
| Fund Manager Tenure | Minimum 5 years | Ensures strategy continuity and experience |
| AUM (Assets Under Management) | Sufficient size (>₹500 Cr) for stability | Very small funds may face liquidity issues; very large may struggle to deploy capital efficiently |
Practical Steps to Build Your ELSS Portfolio
Now that you know what to look for, how do you actually build your position? Start by determining your total eligible investment under Section 80C. If you already have PPF, life insurance premiums, or NPS contributions, calculate the remaining amount needed to reach the ₹1.5 lakh limit. Only then allocate to ELSS.
Use SIPs. Investing a lump sum all at once exposes you to timing risk. If the market corrects shortly after your investment, your capital is locked in for three years at a loss. SIPs allow you to buy units at different price points, averaging out your cost basis. Set up monthly SIPs throughout the financial year to stay within the deduction limit while benefiting from rupee cost averaging.
Diversify across 2-3 ELSS funds. Don't put all your tax-saving eggs in one basket. Choose one large-cap focused ELSS for stability and one that has a slight tilt towards mid-caps for growth potential. Ensure they are managed by different fund houses to avoid concentration risk.
Finally, review annually. While you cannot withdraw during the lock-in, you can assess performance. If a fund consistently underperforms its benchmark and peers for two consecutive years, plan to switch to a better-performing ELSS once the lock-in expires for those units.
Is ELSS better than PPF for tax saving?
It depends on your risk appetite and time horizon. PPF offers guaranteed returns (currently around 7.1% p.a.) and is completely tax-free, but locks money for 15 years. ELSS offers potentially higher returns through equity exposure but carries market risk and is only locked for 3 years. If you can tolerate volatility and want liquidity sooner, ELSS is better. If you prefer safety and guaranteed income, PPF is superior.
Can I withdraw from ELSS before 3 years?
Generally, no. The 3-year lock-in is mandatory from the date of investment. However, in rare cases like medical emergencies or death of the investor, some fund houses may allow premature withdrawal, but this is subject to strict documentation and approval. Treat the lock-in as absolute for planning purposes.
Does the lock-in apply to SIP installments?
Yes, each SIP installment has its own separate 3-year lock-in period. If you start an SIP in January 2024, the January installment unlocks in January 2027, February in February 2027, and so on. This provides staggered liquidity.
What is the ideal asset allocation for an ELSS fund?
Regulations require ELSS funds to invest at least 65% of their assets in equity and equity-related instruments. The rest can be in debt, cash, or derivatives for hedging. Most quality ELSS funds maintain 80-90% equity exposure to maximize growth potential while keeping some cash for opportunities.
Should I choose direct or regular plans for ELSS?
Always choose direct plans if you are comfortable doing research yourself. Direct plans have lower expense ratios because they don't pay commissions to distributors. Over 5-10 years, this difference can add up to significant extra returns. Regular plans are only worth it if you value the advisory service provided by a financial advisor.